
Kashif Khan analyses the current trends of inflation and argues that the government must engage in stringent measures to come out of this economic quagmire.
"It’s the economy, stupid" – this maxim of the Democratic campaign back in the 1992 US presidential elections seems very relevant for Pakistan these days. Pakistan’s economy is going through a turbulent time and its sheer impact on a common man’s daily life is real and painful. Food security is becoming an uphill task for families. The recent data of inflation and other economic indicators available on the websites of Pakistan Bureau of Statistics (PBS) and State Bank of Pakistan (SBP) is pointing towards this grim situation.
According to PBS data, Consumer Price Index (CPI) for food in Sep 2019 was 14.3% compared to 1.4% in Sep 2018. This upward trend of food inflation is quite serious in a country where 21% of the population is undernourished as per Asian Development Bank’s (2015-2017) study. If this study is conducted now, the percentage would possibly be much higher. Inflation is now posing a serious threat to social welfare and human development. The chart below unveils this somber reality.
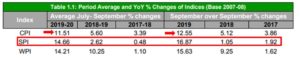
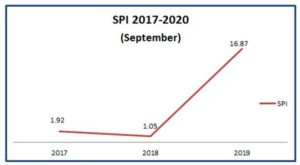
CPI general in Sep 19 stands at 12.55%, which was 5.12% in Sep 18 and 3.86% in Sep 17. The rate of increase in Social Price Index (food & other necessities) percentage is striking. SPI is a whopping 17% for the month of August. The hockey stick growth of SPI inflation is further clarified through this graph.
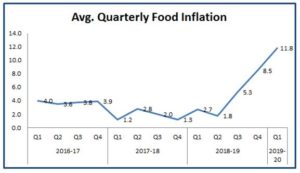
Food inflation for the last three years is summarised below in the average quarterly food inflation graph. This is again showing a high upward trend.
Looking at the numbers, we can certainly conclude that higher food prices are making the basic food items un-affordable for many households. The government must take swift action to control the inflation. According to news reports, government is planning to form special task forces to control prices. Unfortunately, this will do little to solve the issue. The hike in prices is beyond the control of small retail vendors. In fact, Wholesale Price Index, which gauges the inflation at the wholesale level is also quite high and the trickle-down effect of this inflation is evident at the retail level.
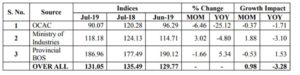
Retail vendors are unable to procure goods at lower prices. Any knee-jerk reaction by authorities such as raids on smaller vendors will only aggravate the situation. The following table clarifies the inflation at different levels.
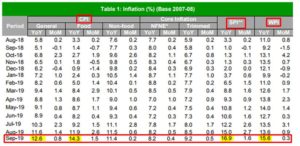
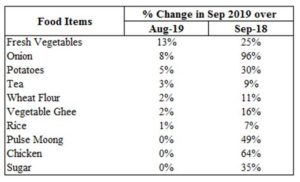
A snapshot of price variance in some of stable food items compared to last month and last year is shown in the table below.
I have stressed in my previous columns and I stress it once again that skyrocketing food inflation is alarming and actions must be taken at the policy level to control this. Price control task forces alone will not be able to help in this regard.
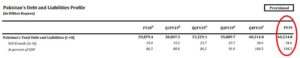
Moving away from inflation, other macro indicators are also troublesome. Pakistan’s total debt and liabilities now represent a staggering 104.3% of GDP. Year-on-year growth in debt is 34.6%.
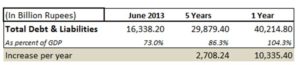
The current government’s rate of borrowing is beyond one’s comprehension. In PML-N’s five-year tenure, the average per year increase was Rs 2,708 billion and total debt increased by Rs 13,541B. Whereas PTI’s federal government has borrowed Rs 10,335B in just one year. This represents 76.3% of the total loan borrowed in the past five years. PML-N justifies its borrowing and claims that many infrastructure and power generation projects were completed in its tenure and these projects of economic importance were not possible without borrowing money. The table below summarises the movement of debt from June 2013 to next five years ending at June 2018, and one year from July 2018 to June 2019.
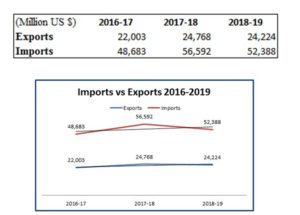
Last month, we saw exports grow by 24%, but as per the historical trend of exports in Pakistan, they are down by -14% in the month of August. What we need is a disruptive business model to boost our exports, whereas currency devaluation was the only rabbit pulled out of a hat by our economic experts to increase our exports. The table below from SBP is showing the cumulative exports for the past three years.
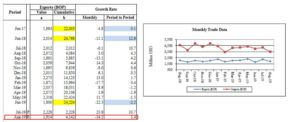
Three years comparison of imports and exports is shown in the table and graph below. Our imports are also low, hence helping to reduce our trade deficit. However, lower imports also indicate a slump in manufacturing activities as we rely on imports for heavy machinery and raw materials.
The decline in large scale manufacturing industry (LSMI) output continues and the output decreased by 3.28% in July 2019 compared to July 2018 and increased by 0.98% if compared to June 2019. Same indicators in July 2017 for LSMI were showing YOY increase of 14.21%.
Performance of some of the main manufacturing sectors according to their weight in the month of July 2019 is shown in the table below.
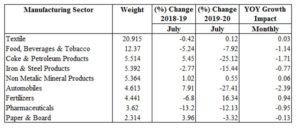
Textile is one of our prime manufacturing sectors, showing a meager YOY growth of 0.03%. The next big sector according to its weight is Food, Beverages and Tobacco which is down by -1.14%. From the above table, it’s clear that most of our manufacturing sectors are showing a downward growth trend.
The government must get its act together to come out of this economic quagmire. It should revisit its economic policies, restore the confidence of businessmen, revise energy prices and ensure political stability. Unless we move in this direction, the dream of economic stability will remain a dream.
"It’s the economy, stupid" – this maxim of the Democratic campaign back in the 1992 US presidential elections seems very relevant for Pakistan these days. Pakistan’s economy is going through a turbulent time and its sheer impact on a common man’s daily life is real and painful. Food security is becoming an uphill task for families. The recent data of inflation and other economic indicators available on the websites of Pakistan Bureau of Statistics (PBS) and State Bank of Pakistan (SBP) is pointing towards this grim situation.
According to PBS data, Consumer Price Index (CPI) for food in Sep 2019 was 14.3% compared to 1.4% in Sep 2018. This upward trend of food inflation is quite serious in a country where 21% of the population is undernourished as per Asian Development Bank’s (2015-2017) study. If this study is conducted now, the percentage would possibly be much higher. Inflation is now posing a serious threat to social welfare and human development. The chart below unveils this somber reality.
CPI general in Sep 19 stands at 12.55%, which was 5.12% in Sep 18 and 3.86% in Sep 17. The rate of increase in Social Price Index (food & other necessities) percentage is striking. SPI is a whopping 17% for the month of August. The hockey stick growth of SPI inflation is further clarified through this graph.
Food inflation for the last three years is summarised below in the average quarterly food inflation graph. This is again showing a high upward trend.
Looking at the numbers, we can certainly conclude that higher food prices are making the basic food items un-affordable for many households. The government must take swift action to control the inflation. According to news reports, government is planning to form special task forces to control prices. Unfortunately, this will do little to solve the issue. The hike in prices is beyond the control of small retail vendors. In fact, Wholesale Price Index, which gauges the inflation at the wholesale level is also quite high and the trickle-down effect of this inflation is evident at the retail level.
Retail vendors are unable to procure goods at lower prices. Any knee-jerk reaction by authorities such as raids on smaller vendors will only aggravate the situation. The following table clarifies the inflation at different levels.
A snapshot of price variance in some of stable food items compared to last month and last year is shown in the table below.
I have stressed in my previous columns and I stress it once again that skyrocketing food inflation is alarming and actions must be taken at the policy level to control this. Price control task forces alone will not be able to help in this regard.
Moving away from inflation, other macro indicators are also troublesome. Pakistan’s total debt and liabilities now represent a staggering 104.3% of GDP. Year-on-year growth in debt is 34.6%.
The current government’s rate of borrowing is beyond one’s comprehension. In PML-N’s five-year tenure, the average per year increase was Rs 2,708 billion and total debt increased by Rs 13,541B. Whereas PTI’s federal government has borrowed Rs 10,335B in just one year. This represents 76.3% of the total loan borrowed in the past five years. PML-N justifies its borrowing and claims that many infrastructure and power generation projects were completed in its tenure and these projects of economic importance were not possible without borrowing money. The table below summarises the movement of debt from June 2013 to next five years ending at June 2018, and one year from July 2018 to June 2019.
Last month, we saw exports grow by 24%, but as per the historical trend of exports in Pakistan, they are down by -14% in the month of August. What we need is a disruptive business model to boost our exports, whereas currency devaluation was the only rabbit pulled out of a hat by our economic experts to increase our exports. The table below from SBP is showing the cumulative exports for the past three years.
Three years comparison of imports and exports is shown in the table and graph below. Our imports are also low, hence helping to reduce our trade deficit. However, lower imports also indicate a slump in manufacturing activities as we rely on imports for heavy machinery and raw materials.
The decline in large scale manufacturing industry (LSMI) output continues and the output decreased by 3.28% in July 2019 compared to July 2018 and increased by 0.98% if compared to June 2019. Same indicators in July 2017 for LSMI were showing YOY increase of 14.21%.
Performance of some of the main manufacturing sectors according to their weight in the month of July 2019 is shown in the table below.
Textile is one of our prime manufacturing sectors, showing a meager YOY growth of 0.03%. The next big sector according to its weight is Food, Beverages and Tobacco which is down by -1.14%. From the above table, it’s clear that most of our manufacturing sectors are showing a downward growth trend.
The government must get its act together to come out of this economic quagmire. It should revisit its economic policies, restore the confidence of businessmen, revise energy prices and ensure political stability. Unless we move in this direction, the dream of economic stability will remain a dream.