“Make the lie big, keep it simple, keep saying it and eventually they will believe it,” this famous or rather infamous quote from Nazi propagandist Joseph Goebbels perfectly fits the bill when it comes to the common man’s perception of Pakistan’s economy.
In my pursuit to truth I started reading different reports and analysis available on the official websites of State Bank of Pakistan (SBP) and Pakistan Bureau of Statistics (PBS). The more I read the more I discovered the mishandling and sheer incompetence of our current economic team. As they say numbers don’t lie so here I am compiling data from government’s own sources to make a point that common man and business is indeed suffering. The facts are in complete contradiction to the tall claims made by PTI before assuming power. My analysis is based on July 2019 data analysis.
I will start with Inflation as this is the main indicator which affects common man the most. CPI & SPI are the tools to gauge this impact, in crude words "mehngaee".
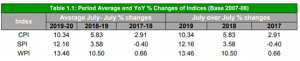
According to the PBS, the inflation in July 2019 (CPI General) has increased by 10.3%. The same was 3.5% back in July 2018 and was 2.91% in July 2017. Astonishing is the increase in SPI which stands at 12.16%.
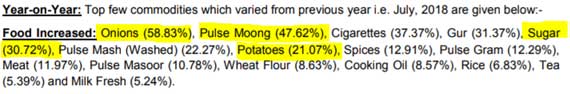
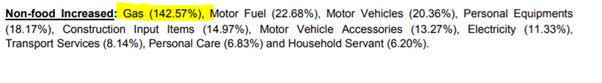
For those who are not familiar with terms CPI & SPI, CPI is consumer price index and SPI is Sensitive Price Index. CPI is general level of inflation i.e. not specific to any category or group of commodities. SPI is more critical as it is directly linked with living expenses i.e. prices of staple food, fuel, utilities, transport etc. To understand the impact of SPI, the price increase in following will help, Onions +59%, Moong dal +49%, Sugar +31% and Gas is on top with whopping +142%. If your gas bill was Rs. 2,000 in Jul 2018 it will be Rs. 4,840 for July 2019.
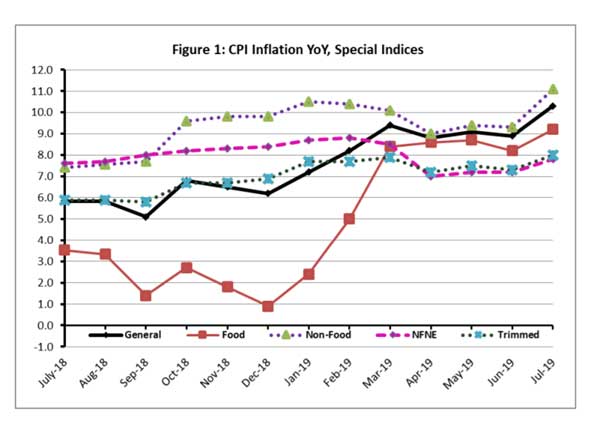
Inflation is summed up nicely in this graph available on PBS website. Dark brown line depicts food inflation, look at the spike from Dec-18 to Mar-19 and its continued upward trend. This is shocking where twenty one percent (21%) of general population is undernourished and thirty eight percent (38%) of children under the age of five are stunted-(source ADBP Basic Statistics 2019)
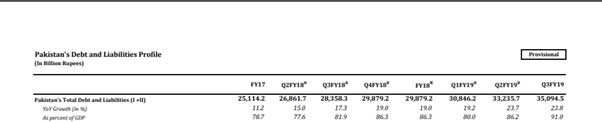
Let’s look at the borrowing now. Current government harshly criticises and to some extent rightly so, the previous governments for borrowing money and in turn increasing the national debt. Interestingly if we make a list of regimes accused of borrowing too much money, present day government’s name will be on top of that list. For Q3 FY-19 the rate of borrowing is increased by 40% compared to FY-17 and 23% compared to same period last year.
Look at the latest table by SBP on borrowing. Check out the debt level for FY-17 and compare it with Q3 FY-19. Quarterly movements are telling us the real story. Shocking is the YOY growth and percentage of debt to GDP. If they continue like this they will match 70 years debt in 5 years.
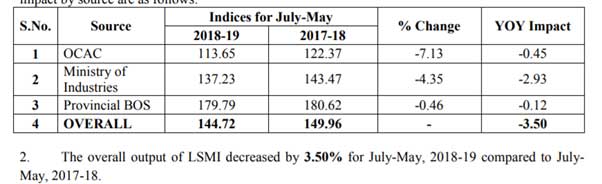
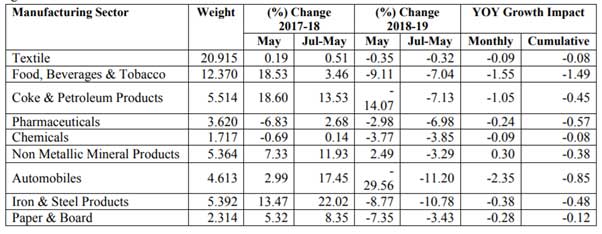
The mishandling of economy is evident through the performance of Large Scale Manufacturing Industry (LSMI). Almost all the main manufacturing sectors of Pakistan are showing decline compared to year 17-18. This is a real bloodbath of Pakistan’s economy.
The performance is no different when it comes to exports. The rupee was devalued to a historical record breaking low hoping to increase exports. However, this technique fell flat on its face and exports are actually decreased by 1%. Please look at the table below.
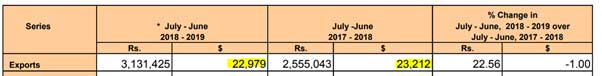
You don’t need to be an expert to understand that with a manufacturing sector in decline simple devaluation technique will not boost exports. Energy policy, interest rate and recent changes in tax laws are some of the factors behind this decline. To defend devaluation, the critics of previous regime say that the rupee was artificially kept overvalued. Setting currency valuation is a complex technique and depends on number of factors. Only people at the helm of affairs at that time can tell us about the underlying reasons. We can only judge their actions through the economic indicators and those were healthier compared to the current ones.
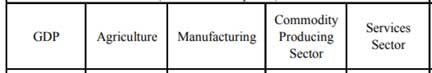
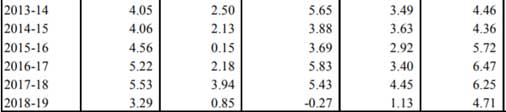
All of the above factors are contributing towards the decline of GDP growth. The GDP this year is 2.24% below 2017-18. Alarming is the decline in Agricultural & Manufacturing sector. Those who understand GDP will know that above 2% decline in GDP is huge.
Following are the key takeaways from one year’s economic performance of the current government where we are told that “ALL” are on one page!
It certainly doesn’t give me any pleasure to show that our economy is going through a very critical stage and if the economic management remains like this the consequences will be far reaching.
To understand the gravity of the situation we need to rise above our political prejudices otherwise we will fall prey to this infamous statement “Make the lie big, keep it simple, keep saying it and eventually they will believe it”.
In my pursuit to truth I started reading different reports and analysis available on the official websites of State Bank of Pakistan (SBP) and Pakistan Bureau of Statistics (PBS). The more I read the more I discovered the mishandling and sheer incompetence of our current economic team. As they say numbers don’t lie so here I am compiling data from government’s own sources to make a point that common man and business is indeed suffering. The facts are in complete contradiction to the tall claims made by PTI before assuming power. My analysis is based on July 2019 data analysis.
I will start with Inflation as this is the main indicator which affects common man the most. CPI & SPI are the tools to gauge this impact, in crude words "mehngaee".
According to the PBS, the inflation in July 2019 (CPI General) has increased by 10.3%. The same was 3.5% back in July 2018 and was 2.91% in July 2017. Astonishing is the increase in SPI which stands at 12.16%.
For those who are not familiar with terms CPI & SPI, CPI is consumer price index and SPI is Sensitive Price Index. CPI is general level of inflation i.e. not specific to any category or group of commodities. SPI is more critical as it is directly linked with living expenses i.e. prices of staple food, fuel, utilities, transport etc. To understand the impact of SPI, the price increase in following will help, Onions +59%, Moong dal +49%, Sugar +31% and Gas is on top with whopping +142%. If your gas bill was Rs. 2,000 in Jul 2018 it will be Rs. 4,840 for July 2019.
Inflation is summed up nicely in this graph available on PBS website. Dark brown line depicts food inflation, look at the spike from Dec-18 to Mar-19 and its continued upward trend. This is shocking where twenty one percent (21%) of general population is undernourished and thirty eight percent (38%) of children under the age of five are stunted-(source ADBP Basic Statistics 2019)
Let’s look at the borrowing now. Current government harshly criticises and to some extent rightly so, the previous governments for borrowing money and in turn increasing the national debt. Interestingly if we make a list of regimes accused of borrowing too much money, present day government’s name will be on top of that list. For Q3 FY-19 the rate of borrowing is increased by 40% compared to FY-17 and 23% compared to same period last year.
Look at the latest table by SBP on borrowing. Check out the debt level for FY-17 and compare it with Q3 FY-19. Quarterly movements are telling us the real story. Shocking is the YOY growth and percentage of debt to GDP. If they continue like this they will match 70 years debt in 5 years.
The mishandling of economy is evident through the performance of Large Scale Manufacturing Industry (LSMI). Almost all the main manufacturing sectors of Pakistan are showing decline compared to year 17-18. This is a real bloodbath of Pakistan’s economy.
The performance is no different when it comes to exports. The rupee was devalued to a historical record breaking low hoping to increase exports. However, this technique fell flat on its face and exports are actually decreased by 1%. Please look at the table below.
You don’t need to be an expert to understand that with a manufacturing sector in decline simple devaluation technique will not boost exports. Energy policy, interest rate and recent changes in tax laws are some of the factors behind this decline. To defend devaluation, the critics of previous regime say that the rupee was artificially kept overvalued. Setting currency valuation is a complex technique and depends on number of factors. Only people at the helm of affairs at that time can tell us about the underlying reasons. We can only judge their actions through the economic indicators and those were healthier compared to the current ones.
All of the above factors are contributing towards the decline of GDP growth. The GDP this year is 2.24% below 2017-18. Alarming is the decline in Agricultural & Manufacturing sector. Those who understand GDP will know that above 2% decline in GDP is huge.
Following are the key takeaways from one year’s economic performance of the current government where we are told that “ALL” are on one page!
- GDP down by 2%
- Exports down by 1%
- LSMI down by 3.50%
- Debt up by 24% (FY-17 +40%)
- Inflation up by 77%
It certainly doesn’t give me any pleasure to show that our economy is going through a very critical stage and if the economic management remains like this the consequences will be far reaching.
To understand the gravity of the situation we need to rise above our political prejudices otherwise we will fall prey to this infamous statement “Make the lie big, keep it simple, keep saying it and eventually they will believe it”.